Integrated Systems Research +
Data Visualization
CLIENT
Confidential Client
TIMESCALE
1 year; 2 phases
COLLABORATION
Mithun, Consultants, including structural, MEP, and construction management
CONTRIBUTION
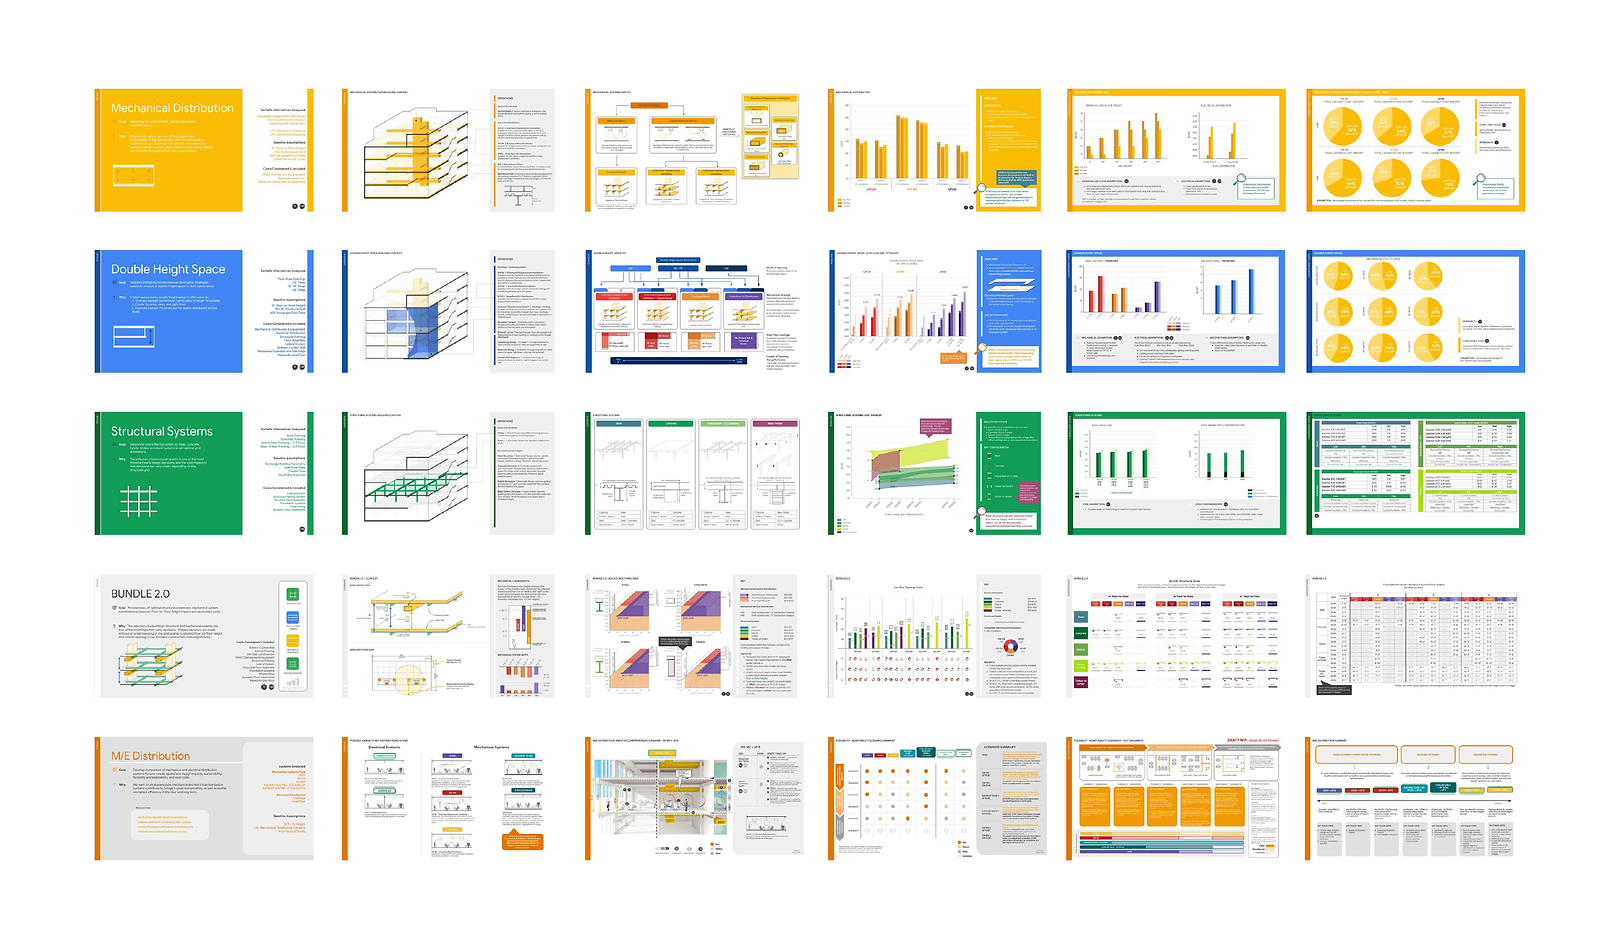
Led a team in developing a 500+ page knowledge system for a large tech client, transforming qualitative and quantitative research into an intuitive, data-driven UX framework with interactive visualization and structured design systems.
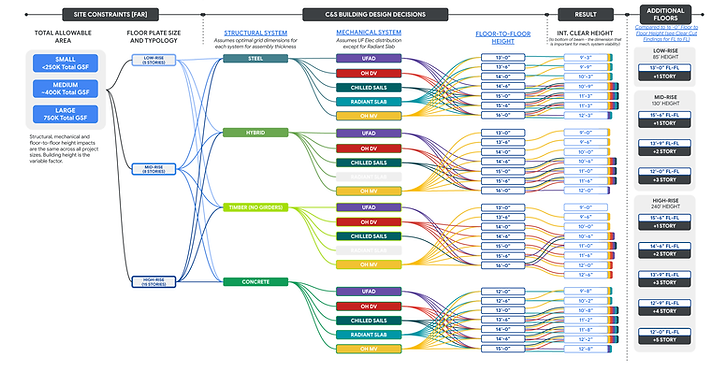
Objective: Implement data-driven methodologies to improve the initiation of building projects, ensuring more consistent and favorable outcomes for the business. Streamline decision-making by bringing rigor and data into the process, providing a framework methodology and valuable findings for use by various consultant and stakeholder teams.
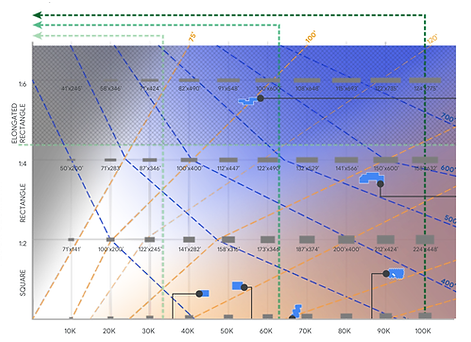
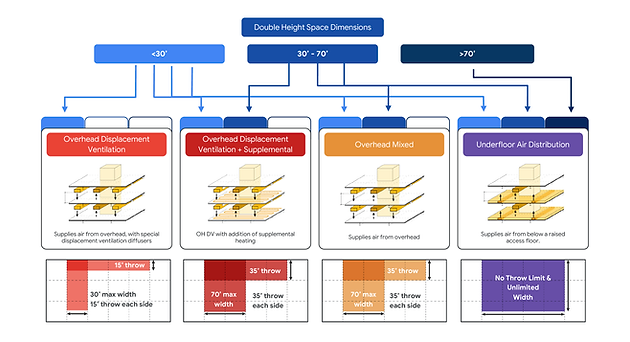
Approach: Led the team and collaborated with consultants to conduct a comprehensive cost mapping analysis, integrating 13 variables. Provided meticulous data analysis and created visually engaging data visualizations for each variable.
Results: Produced three comprehensive documents analyzing cost mapping, benefits, and trade-offs, synthesizing all analyses to be utilized by stakeholders at all levels across the entire division of the company. The study resulted in a 510-page in-depth analysis, providing valuable insights for decision-making and strategic planning.